The Case for Waterfall Charts

Sound familiar?
Know that “over the edge” feeling when you find out the production plan you have in place…. And have had in place for several weeks…. Is not going to work for current demand?
Yeah, we’ve been there……..and despite cries to “fix the forecast” we know that’s most likely NOT going to happen.
So, when I mention the word “forecast,” what is the first word that comes to mind? “Wrong” is often the answer. One thing many of us can agree on is forecasts are (or seem to be) inherently wrong. And they are “wrong” sometimes in ways that hurt our competitiveness and cash flow, such as
-
- buying too much or too little raw materials,
- producing the wrong product mix,
- staffing under- or over-capacity,
- and so on.
In my experience, these “errors” in forecasts can lead to some uncomfortable meetings as plant managers unleash their anger about missed targets against the sales and/or scheduling departments whose forecasts were critical in decision-making.
Beyond the finance department
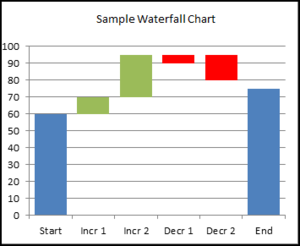 Mention “waterfall chart” and you immediately have the attention of the financial personnel on your team. Few others may show much interest or shrug it off as “a financial thing…..” It’s true. These charts are most often used to depict changes between two points in revenue (or inventory, etc.). Sometimes waterfall charts are referenced as “Mario charts” due to the presence of suspended blocks used in the walk-across between the two periods, similar to a Super Mario Bros. video game.
For plant production planning or forecasting, is there value in using a waterfall chart? The answer to that question is “yes” but in a different format! What if we also told you a waterfall chart can produce a win-win among your company’s departments by increasing communication, simplifying paperwork, and fostering collaboration? Interested? Let’s talk a bit more…..
No more blame game
During a contract engagement in Korea, I participated in some of the “discussions” between the sales and manufacturing departments due to perceived errors / changes in forecasts that were the cause of some disastrous manufacturing decisions. Without a clear path for increasing reliability of the forecasts, we shifted our focus to developing a methodology for determining the amount of over- or under-planning that could be accepted by the team.
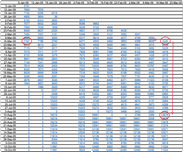 To accomplish this, we needed to track the “movement” of schedules for a specific week as the weeks moved in from forecast to current. Our tool? The Waterfall Chart but in a different format.
In its use, this tool provided each product team a historical perspective of both the short- and long-term schedule reliability as these moved from forecast to current week. In some cases, depending on lead times, this could be as much as 40-weeks, especially for those products with long-lead components or raw materials. In application, the waterfall chart reduced our mountain of paperwork to a single page presentation for discussion by the team.
Discussions went from the “blame game” to how can/should we respond as we see this schedule movement. The sales department could concentrate on understanding what was driving the changes in the forecast, and the manufacturing department could better collaborate with sales about an appropriate manufacturing reaction plan to ensure minimal costs and to meet the needs of the sales organization.
Working together for a win-win
Applicable within an organization’s departments (sales to manufacturing), this tool is also applicable between an organization’s supply chain: OEM to Tier One, Tier One to lower Tiers. So, while you are working with the “customer” organization to increase the reliability of their forecasts, the customer/supplier can also be working together to agree on how to minimize risk and costs. Truly a win-win!
Think this tool can work for you?
Contact HVMC at info@highvaluemanufacturingconsulting.com to learn more and get the assistance you need to put this tool in your toolkit!
Did you enjoy this blog? Search our blog library for other topics of interest: https://highvaluemanufacturingconsulting.com/blog/